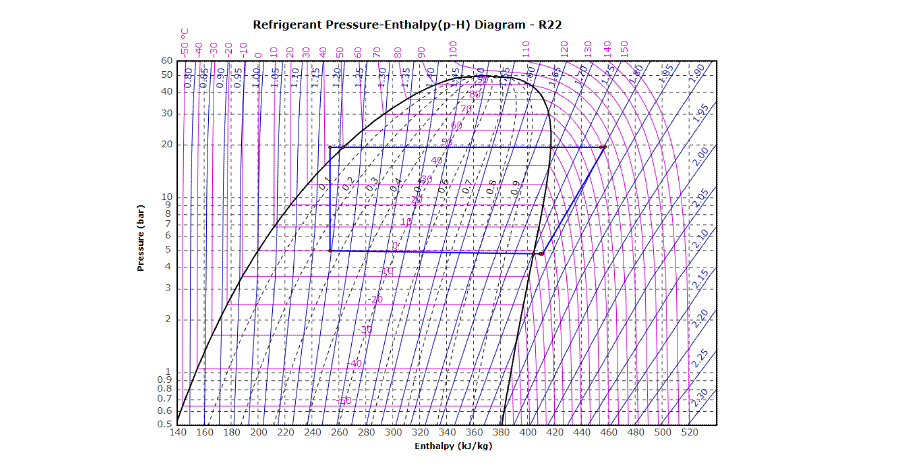
Online Interactive p-H and T-s Diagram. Please allow more processing time for mixed refrigerant.
Click on diagram for properties
Pressure, bar
Enthalpy, kJ/kg
Quantity Value Units
Refrigerant
Pressure bar
Enthalpy kJ/kg
Temperature °C
Entropy kJ/(kg*K)
Quality/Dryness -
Heat Capacity kJ/(kg*K)
Ratio Cp/Cv -
Density kg/m3
Dyna. Viscosity mPa*s
Kine. Viscosity cSt
Thermal Cond. W/(m*K)
Process calculation
# P, bar Enthalpy, kJ/kg
Set point to -1,-1 to start new line.
Single Stage Cycle
Quantity Value Unit
Evaporator
T.evaporating °C
T.superheating K
P.drop bar
Refrigerating cap. W
Condenser
T.condensing °C
T.subcooling K
P.drop bar
Compressor
Isentropic efficiency -
Suction Line
Superheat K
P.drop bar
Discharge Line
T.drop K
P.drop bar
Calculation output
Mass flow kg/h
Volume flow m3/h
COP -
Single Stage Cycle With Internal Heat Exchanger
Quantity Value Unit
Evaporator
T.evaporating °C
T.superheating K
P.drop bar
Refrigerating cap. W
Condenser
T.condensing °C
T.subcooling K
P.drop bar
Internal HX
min.T.differential K
P.drop.gas bar
Compressor
Isentropic efficiency -
Suction Line
Superheat K
P.drop bar
Discharge Line
T.drop K
P.drop bar
Calculation output
Mass flow kg/h
Volume flow m3/h
COP -
Single Stage Cycle With Intercooler
Quantity Value Unit
Evaporator
T.evaporating °C
T.superheating K
P.drop bar
Refrigerating cap. W
Condenser
T.condensing °C
T.subcooling K
P.drop bar
Compressor
LP.Isentr. efficiency -
HP.Isentr. efficiency -
P.intermediate bar
Intercooler
T.outlet °C
P.drop bar
Suction Line
Superheat K
P.drop bar
Discharge Line
T.drop K
P.drop bar
Calculation output
Mass flow kg/h
LP Volume flow m3/h
HP Volume flow m3/h
COP -
Single Stage Cycle With Economiser
Quantity Value Unit
Evaporator
T.evaporating °C
T.superheating K
P.drop bar
Refrigerating cap. W
Condenser
T.condensing °C
T.subcooling K
P.drop bar
Compressor
LP.Isentr. efficiency -
HP.Isentr. efficiency -
P.intermediate bar
Economiser
min.T.differential K
Given superheat K
Given flow ratio -
Suction Line
Superheat K
P.drop bar
Discharge Line
T.drop K
P.drop bar
Calculation output
LP Mass flow kg/h
HP Mass flow kg/h
LP Volume flow m3/h
HP Volume flow m3/h
COP -
Single Stage Cycle With Liquid Injection
Quantity Value Unit
Evaporator
T.evaporating °C
T.superheating K
P.drop bar
Refrigerating cap. W
Condenser
T.condensing °C
T.subcooling K
P.drop bar
Compressor
LP.Isentr. efficiency -
HP.Isentr. efficiency -
P.intermediate bar
Intermediate Injection
Given superheat K
Given Inj. flow ratio -
Suction Line
Superheat K
P.drop bar
Discharge Line
T.drop K
P.drop bar
Calculation output
LP Mass flow kg/h
HP Mass flow kg/h
LP Volume flow m3/h
HP Volume flow m3/h
COP -
Transcritical Cycle
Quantity Value Unit
Evaporator
T.evaporating °C
T.superheating K
P.drop bar
Gas Cooler
T.outlet °C
P.drop bar
Heating capacity W
Compressor
Isentropic efficiency -
P.output bar
Suction Line
Superheat K
P.drop bar
Discharge Line
T.drop K
P.drop bar
Calculation output
Mass flow kg/h
Volume flow m3/h
COPh -
OGC - Organic Rankine Cycle
Quantity Value Unit
Steam Generator
T.evaporating °C
T.superheating K
Heating capacity kW
Condenser
T.condensing °C
T.subcooling K
Pump
Comp. Efficiency -
Expander
Exp. Efficiency -
Calculation output
Mass flow kg/h
Volume flow m3/h
Pump power feed kW
Exp. power output kW
Therm. Efficiency -
OGC - Organic Rankine Cycle With Internal Heat Exchanger
Quantity Value Unit
Steam Generator
T.evaporating °C
T.superheating K
Heating capacity kW
Condenser
T.condensing °C
T.subcooling K
Pump
Comp. Efficiency -
Expander
Exp. Efficiency -
Internal HX
min. T. differential -
Calculation output
Mass flow kg/h
Volume flow m3/h
Pump power feed kW
Exp. power output kW
Therm. Efficiency -
Diagram ranges:
p-H Diagram
Min.Entalpy kJ/kg
Max.Enthalpy kJ/kg
Min.Pressure bar
Max.Pressure bar
T-s Diagram
Min.Entropy kJ/(kg*K)
Max.Entropy kJ/(kg*K)
Min.Temperature °C
Max.Temperature °C
Diagram lines:
p-H Diagram
T-s Diagram
Display settings
Item Color Line.Style Width
BackGround
Frame
Saturation
Quality
Process Line
p-H Diagram
Pressure
Enthalpy
Temperature
Entropy
T-s Diagram
Temperature
Entropy
Pressure
Enthalpy
Display preset:
Isotherm, °CIsentrop, kJ/(kg*K)QualityIsochor, m^3/kg 140160180200220240260280300320340360380400420440460480500520 0.50.60.70.80.9123456789102030405060 -30-30 °C-20-20-10-1000101020203030404050506060707080809090100110120130140150 0.850.900.951.001.051.101.151.201.251.301.351.401.451.501.551.601.651.701.751.801.851.901.952.002.052.102.152.202.25 0.10.20.30.40.50.60.70.80.9 0.0070.0090.0200.0300.0400.0500.0600.0800.1000.2000.3000.4000.5000.6000.800 Enthalpy (kJ/kg) Pressure (bar) Refrigerant Pressure - Enthalpy(p - H) Diagram - R22 Sorry, your browser does not support inline SVG.
Isobar, barIsenthalp, kJ/kgQualityIsochor, m^3/kg 180200220240260280300320340360380420440460480500520 2 bar34682030405060 -40-30-20-100102030405060708090100110120130140150 0.80.911.11.21.31.41.51.61.71.81.922.12.2 0.10.20.30.40.50.60.70.80.9 0.0020.0030.0040.0050.0070.0090.0200.0300.0500.0700.1000.2000.3000.5000.700 Entropy (kJ/(kg*K)) Temperature (°C) Refrigerant Temperature-Entropy(T-s) Diagram - R22 Sorry, your browser does not support inline SVG.
Process calculation result
Point P t h s v x
bar °C kJ/kg kJ/(kg*K) m3/kg -
Star Scroll Compressor

Efficient, Quiet, Extremely Simple, and More.

Want to make prototypes for your industry?

Learn More
Twin-Rotor Oil-Free Compressor

High Volume Efficiency, Simple Structure, Coming Soon.

Download Unit Converter App
FlyCarpet Unit Converter